

THE 'BIG' FOUR MLB REGULAR SEASON AWARDS ANNOUNCED (Part 2)
THE 'BIG' FOUR MLB REGULAR SEASON AWARDS ANNOUNCED (Part 2)
The Cy Young and MVP winners were tough to argue. Overall, the Baseball Writers' Association got it right.

Yesterday, in Part 1 of the BIG FOUR MLB AWARDS I discussed the ROY and MOY results, which you can see here. Today, it’s all about the Cy Young and MVP. Four players and four awards. Let’s get to it.
Below are the results for the Cy Young and MVP awards in each league. As mentioned in Part 1, I decided to grade the voters on a scale of 1-10 and explain why for each. 0-awful, 10-perfect. The grade is not only based on the top spot for each category but the rest of it as well.
CY YOUNG
Grade: 9 (Excellent)
Reasons
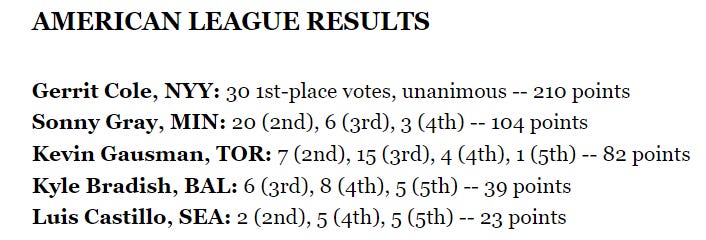
After Gerrit Cole, it’s hard to find much of a difference between Sonny Gray and Kevin Gausman. They both had solid campaigns, threw nearly identical innings, and their overall numbers were close, but they do favor Gray in the end. Kyle Bradish and Luis Castillo finished right where they should have and the top five looks accurate.
Cole finally earned his first Cy Young award and he deserved the unanimous selection. There was never any doubt after the regular season came to an end that Gerrit would claim this honor. He went 15-4 on a mediocre Yankees team and led the league in innings pitched (209), ERA (2.63), WHIP (0.981), and shutouts (2). I’m always reminded of what generation we’re in when I see a pitching leader lead the league in something like complete games or shutouts with one or two in this day and age of so few innings pitched. But, Cole did it twice and the leader is the leader. Congrats to the Yankees ace.
Final Thought
You could argue that the grade for this category should be a perfect 10. And it could be. I think the voters were perfect with the Top 5.

Grade: 9 (Excellent)
Reasons
Did you know that only five players in all of MLB threw 200 or more frames in 2023? In 2022, eight players reached that number following the first full season after Covid in 2021 when only four hit the mark understandably (only 60 games the year before and everyone knew that the workload for starting pitchers would be fewer than in past seasons).
To show how far starting hurlers have fallen from the times of being expected to eat their fair share of innings; in 2019, there were three times as many SPs who threw 200 or more frames (15 total) as there were in our most recent season. One of the reasons I respect Cole so much is that in 10 non-Covid campaigns, he has reached the 200-inning mark six times.
When I see Blake Snell win the award with 180 innings pitched for the second time in his career, it makes me realize how much more valuable it is to have a reliable workhorse like the Yankees have in Mr. Cole. Gerrit threw 29 more innings than Snell and made only one more start. Do the math and you see on a per-start basis that the difference between this year’s two Cy Young winners is monumental. I’ll take the AL winner every time.
Saying all of that, the voters did get the NL victor correct. Snell had a fine season and his 14-9 record along with an MLB-best 2.25 ERA was impressive. In five September starts, Snell reached at least six frames in each and allowed a mere two runs in 31 innings on the bump. That sealed the Cy deal for many voters I am sure.
Had the NL wins and strikeout leader Spencer Strider not finished as poorly as he did over the final month of the regular season (5.60 ERA), then he probably would have ended up no worse than second for this award and, perhaps, claimed it. The funny thing is that despite Strider having an ERA north of five in September, his record was 4-1, which is why the win-loss stat has been used less and less with each passing season when deciding the Cy Young winners. If you have a good offense, you can get away with giving up runs, and the Braves had one of the best we’ve ever seen. Justin Steele (1-2, 4.91 ERA in September) fell out of contention late in the year for the Cubs as well. Both Strider’s and Steele’s placement on the list seems justified.
Final Thought
Logan Webb and Zac Gallen were two of the four players mentioned earlier that reached 200 innings. Webb led all of MLB with 216 IP while Gallen was second with 210. They each had quality seasons, but their ERAs were both a full run or higher than Snell’s and that is ultimately the stat I believe the voters used as the decider.
Blake’s ERA and high K rate (234 strikeouts in 180 IP) were enough to win a Cy Young in a year when there was only one no-doubt best arm in all of baseball, Gerrit Cole, followed by a solid mix of pitchers a notch below. There was very little difference in the overall numbers between the top five in each league after Cole.
MOST VALUABLE PLAYER
Grade: 7 (Above Average, but could be better)
Reasons
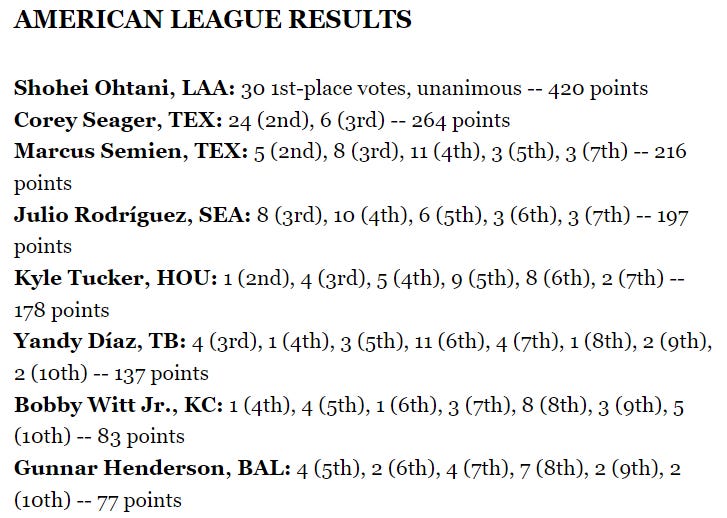
Shohei Ohtani = unanimous winner. That’s fine. I can’t argue with any of the numbers he posted except for his games played (135) and his team’s record (73-89, 15 games out of playoffs). Ohtani was great with the bat and good on the bump. His final numbers were as follows:
Offense: 135 GP, .304/.412/.659 slash line and led the AL in the latter two (.OBP and Slug). Shotime also led the league in homers with 44. His other stats were MVP-level as well…102 runs, 95 RBI, 20 stolen bases.
Pitching: 23 GS, 132 IP, 10-5 record, 3.14 ERA, 1.06 WHIP, 167 strikeouts, and 55 walks.
There was no one better overall statistically in the AL given his good numbers across the board at the plate and on the hill. Even though he missed about a month’s worth of action due to injury, he still played in more games than the runner-up Corey Seager did. The Rangers shortstop participated in 119 contests with a slash line of .327/.390/.623. Seager led the league in doubles with 42 and belted 33 homers while driving in 96. That’s a good year, but where I think voters got it wrong is with the order after Shohei at the top.
Let me start with this. Of the eight players shown on the list above, Ohtani and Seager played in the fewest amount of games. No one else played in fewer than 150 except Yandy Diaz (137). Seager’s teammate, Marcus Semien, showed up for all 162 contests and led the league in at-bats (670), hits (185), and runs (122). In theory, if Seager had played a full season, then more than likely, his counting stats would have blown Semien’s out of the water. I understand that.
However, at some point, it would be nice for voters to recognize the value of showing up every day and being productive over putting up better numbers in a shorter timeframe and being rewarded for missing 30 or more games (I’m talking to you Mike Trout fans). I touched on this yesterday when mentioning how Matt McLain finished ahead of Spencer Steer in the ROY ballot, yet the latter played in 67 more contests. My thought applies to the Texas teammates in this case as well.
Was Seager in 119 games more valuable to the Rangers regular season success than Semien was over 162? What was Corey doing of value in those 43 missed games? That’s a lot of time on the pine. We don’t know what he would have done if healthy. One can assume, but we will never know for sure.
Overall, Seager had more homers and doubles, but Semien had more hits, triples, runs scored, RBI, and stolen bases. In this case, the counting stats such as games played and total numbers (not the what-if, on-pace stats) should have been recognized. Semien’s value to the Rangers by playing every day during the regular season was higher than Seager’s great numbers over 4 1/2 healthy months.
Final Thought
I would also argue that Kyle Tucker should have been higher on this list than fifth. He certainly, though it was close, had a better statistical year than fourth-place finisher Julio Rodriguez.
Tucker: 157 GP with a slash line of .284/.369/.517 to go with 29 homers, 37 doubles, five triples, 97 runs, an AL-best 112 RBI, and 30 stolen bases.
Rodriguez: 155 GP with a .275/.333/.485 slash line while hitting 32 long balls, 37 doubles, two triples, 102 runs, 103 RBI, and 37 stolen bases.
Though Julio had seven more thefts, he was caught stealing twice as many times with 10 to Tucker’s five. Also, Kyle’s team won the AL West and Rodriguez’s Mariners fell short of the postseason on the final weekend. I know team wins seem to not matter as much today when it comes to MVP results, but it should definitely serve as a tiebreaker when two players are as close statistically as these two were.
Lastly, and probably the most eye-opening stat I want to give you before moving on. I did some research going back to 1980. That’s 44 seasons and 88 MVPs. Here are the facts:
Only eight times in that period has an MVP come from a losing team (record under .500).
Two times the winners have come from the National League.
1987-Andre Dawson (Cubs, 76-85)
2017-Giancarlo Stanton (Marlins, 77-85)
Six of the eight winners came from the American League with only two of them before 2016.
1991-Cal Ripken (Orioles, 67-95)
2003-Alex Rodriguez (Rangers, 71-91)
50% of the eight MVP winners from a losing team over the last 44 seasons have been members of the Anaheim Angels. Those four winners (Trout and Ohtani with two each) have come in the last eight seasons when the Halos finished well under .500 in each of those campaigns.
2016-Mike Trout (Angels, 74-88, 4th place AL West)
2019-Mike Trout (Angels, 72-90, 4th place AL West)
2021-Shohei Ohtani (Angels, 77-85, 4th place AL West)
2023-Shohei Ohtani (Angels, 73-89, 4th place AL West)
It’s incredible to think that the Angels have had five MVPs in the last 10 seasons and haven’t had a winning record for eight consecutive years. The combined record of the franchise in those four MVP campaigns was 296-352. Where’s the value in that?

Grade: 10 (Perfect)
This would have been graded a 9 had Mookie Betts received one first-place vote as many thought he might. The voters got this one correct from 1-5 and history is only going to remember the top four because they were arguably the most talked about top four candidates from one league in one season that we’ve ever seen. From midsummer on, it was all about the four guys from the top two teams in the National League. In the end, Ronald Acuna Jr. won in a landslide and there was no other legit way it could have gone.
The Acuna vs. Betts comparison
Acuna: 159 GP, Slash Line, .337/.416/.596 with 41 taters, 35 two-baggers, 4 triples, and 106 RBI. Acuna led the league in hits (217), on-base percentage (shown in slash line), OPS (1.012), runs scored (149), and stolen bases (73).
Betts: 152 GP, Slash Line, .307/.410/.567 with 39 homers, 40 doubles, 1 triple, 126 runs, 107 RBI, and 14 stolen bases.
Betts also led the league with an 8.3 WAR compared to Acuna’s 8.2, and a lot of that had to do with playing multiple positions and all of that other nonsense that supporters of Mookie for MVP were using to make his case throughout the season. I challenge anyone to recite the formula for WAR without looking it up….No?
Let me give the “simplest version” found in most glossaries. This doesn’t count for how the numbers within the numbers are calculated. I’m sure you can find a class online called ‘WAR 101’ if you want to know everything. Even in its easiest form, I find myself wanting to turn my attention to anything else.
WAR for position players = (The number of runs above average a player is worth in his batting, baserunning and fielding + adjustment for position + adjustment for league + the number of runs provided by a replacement-level player) / runs per win.
(Yawn) Anyway, the bottom line was that the voters were smart enough to realize that it wasn’t Acuna’s fault that Dodgers manager Dave Roberts needed Betts to replace his injured middle infield (70 games at second, 16 at short); so why punish the Braves star? Acuna played well in right field even though his Defensive WAR was -0.7 somehow. Unless a player is a major detriment to his team defensively, I can never use fielding as a reason not to vote for a player as league MVP if his offensive numbers are as otherworldly as Ronald’s were in ‘23. What Mookie did was admirable, but certainly not enough to come close in the MVP conversation. Good job BBWAA.
Final Thought
As far as the two first basemen Freddie Freeman and Matt Olson are concerned; neither was going to come close to winning this award despite stellar seasons. I could make an argument for Freeman finishing ahead of Betts for second, but that’s about it. Olson was an easy fourth choice and NL ROY Corbin Carroll was a no-brainer fifth-place finisher. Carroll is 23 and it wouldn’t surprise me if next season he finished in the top three and maybe even won the MVP.
That wraps up the BIG FOUR Awards discussion. Other than the NL MOY winner Skip Schumaker, and a few hiccups in order after the top spots in certain categories, there wasn’t much to complain about. Most importantly, the winners for the ROY, Cy Young, and MVP were spot-on. Those are the names that will forever be in the history books and rightfully so.
Feel free to comment below if you have any thoughts on how the results turned out for these awards.
I hope everyone has a great Thanksgiving. I’ll be back next week with an update on the blog and plans for the winter. Enjoy the rest of the day. Thanks for stopping by.